

Bayfield's Third Quarter: Three Sales, Each Faster Than the Last
Three homes closed in the City of Bayfield this summer, one in each month. That is a small number, so this post sticks to what those three sales show and leaves the guessing out. What they show is a clear three-step pattern worth a look.
QUARTER 3 AT A GLANCE
Closed sales | 3
Average sale price | $346,667
Median sale price | $340,000
Average days on market | 35.3
Median days on market | 9
How they sold | 2 conventional, 1 cash
Bayfield's three Quarter 3 sales matched the total of the first half of the year combined. It also made up half of the year's six closings and about 56 percent of the year's $1.86 million in sales volume.
What sold?
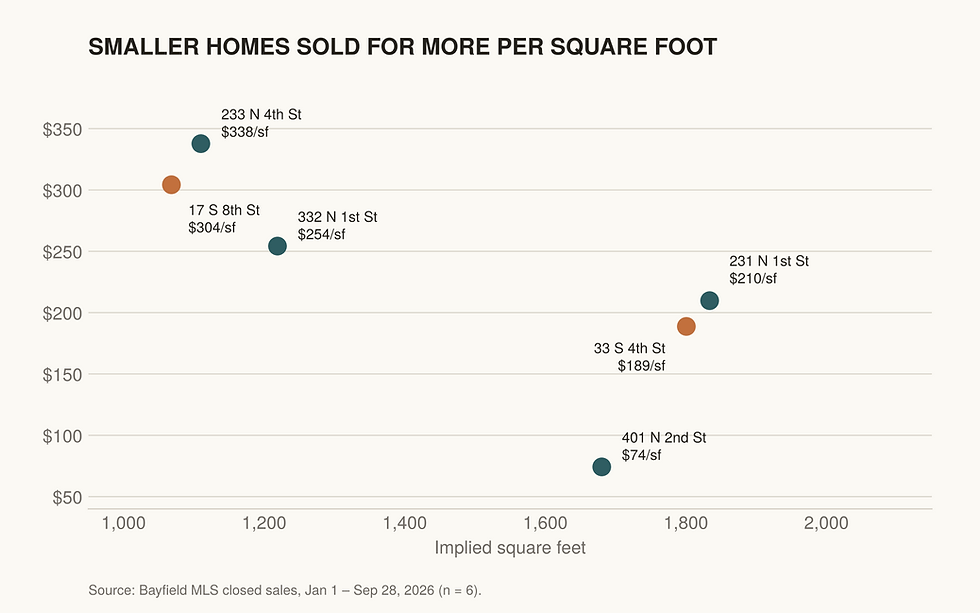
33 S 4th Street, $340,000
The home was listed for $365,000 and sold for 93.2 percent of that price. It was on the market for 93 days and sold with conventional financing.
17 S 8th Street, $325,000
This one sold for its $325,000 asking price after nine days. It sold through a conventional loan.
233 N 4th Street, $375,000
This home sold for 114% of asking, $329,000 after four days on the market. The buyer paid cash.
Each month's sale took less time than the one before, and each closed closer to, or further above, its asking price. The price per square foot rose each month too.
How did Quarter 3 compare to Quarter 2?
The average price barely moved: $347,500 in the second quarter and $346,667 in the third. The difference is in speed. Average days on market fell from 66.5 to 35.3, and the third quarter's median was 9 days. The third quarter was also the first in which any home sold with conventional financing. Both second-quarter sales were cash.


Comments